Footfall & Conversion Dashboard
Background
This is a Footfall & Conversion Report that I developed for my previous company. The data presented has been modified for demonstration purposes. Footfall and conversion rates are critical for management to understand traffic and the market atmosphere, especially after the pandemic lockdown. This dashboard aims to provide an overview of retail store performance regarding traffic and conversion, with actionable insights that can be derived from the visualizations.
Dashbaord Design

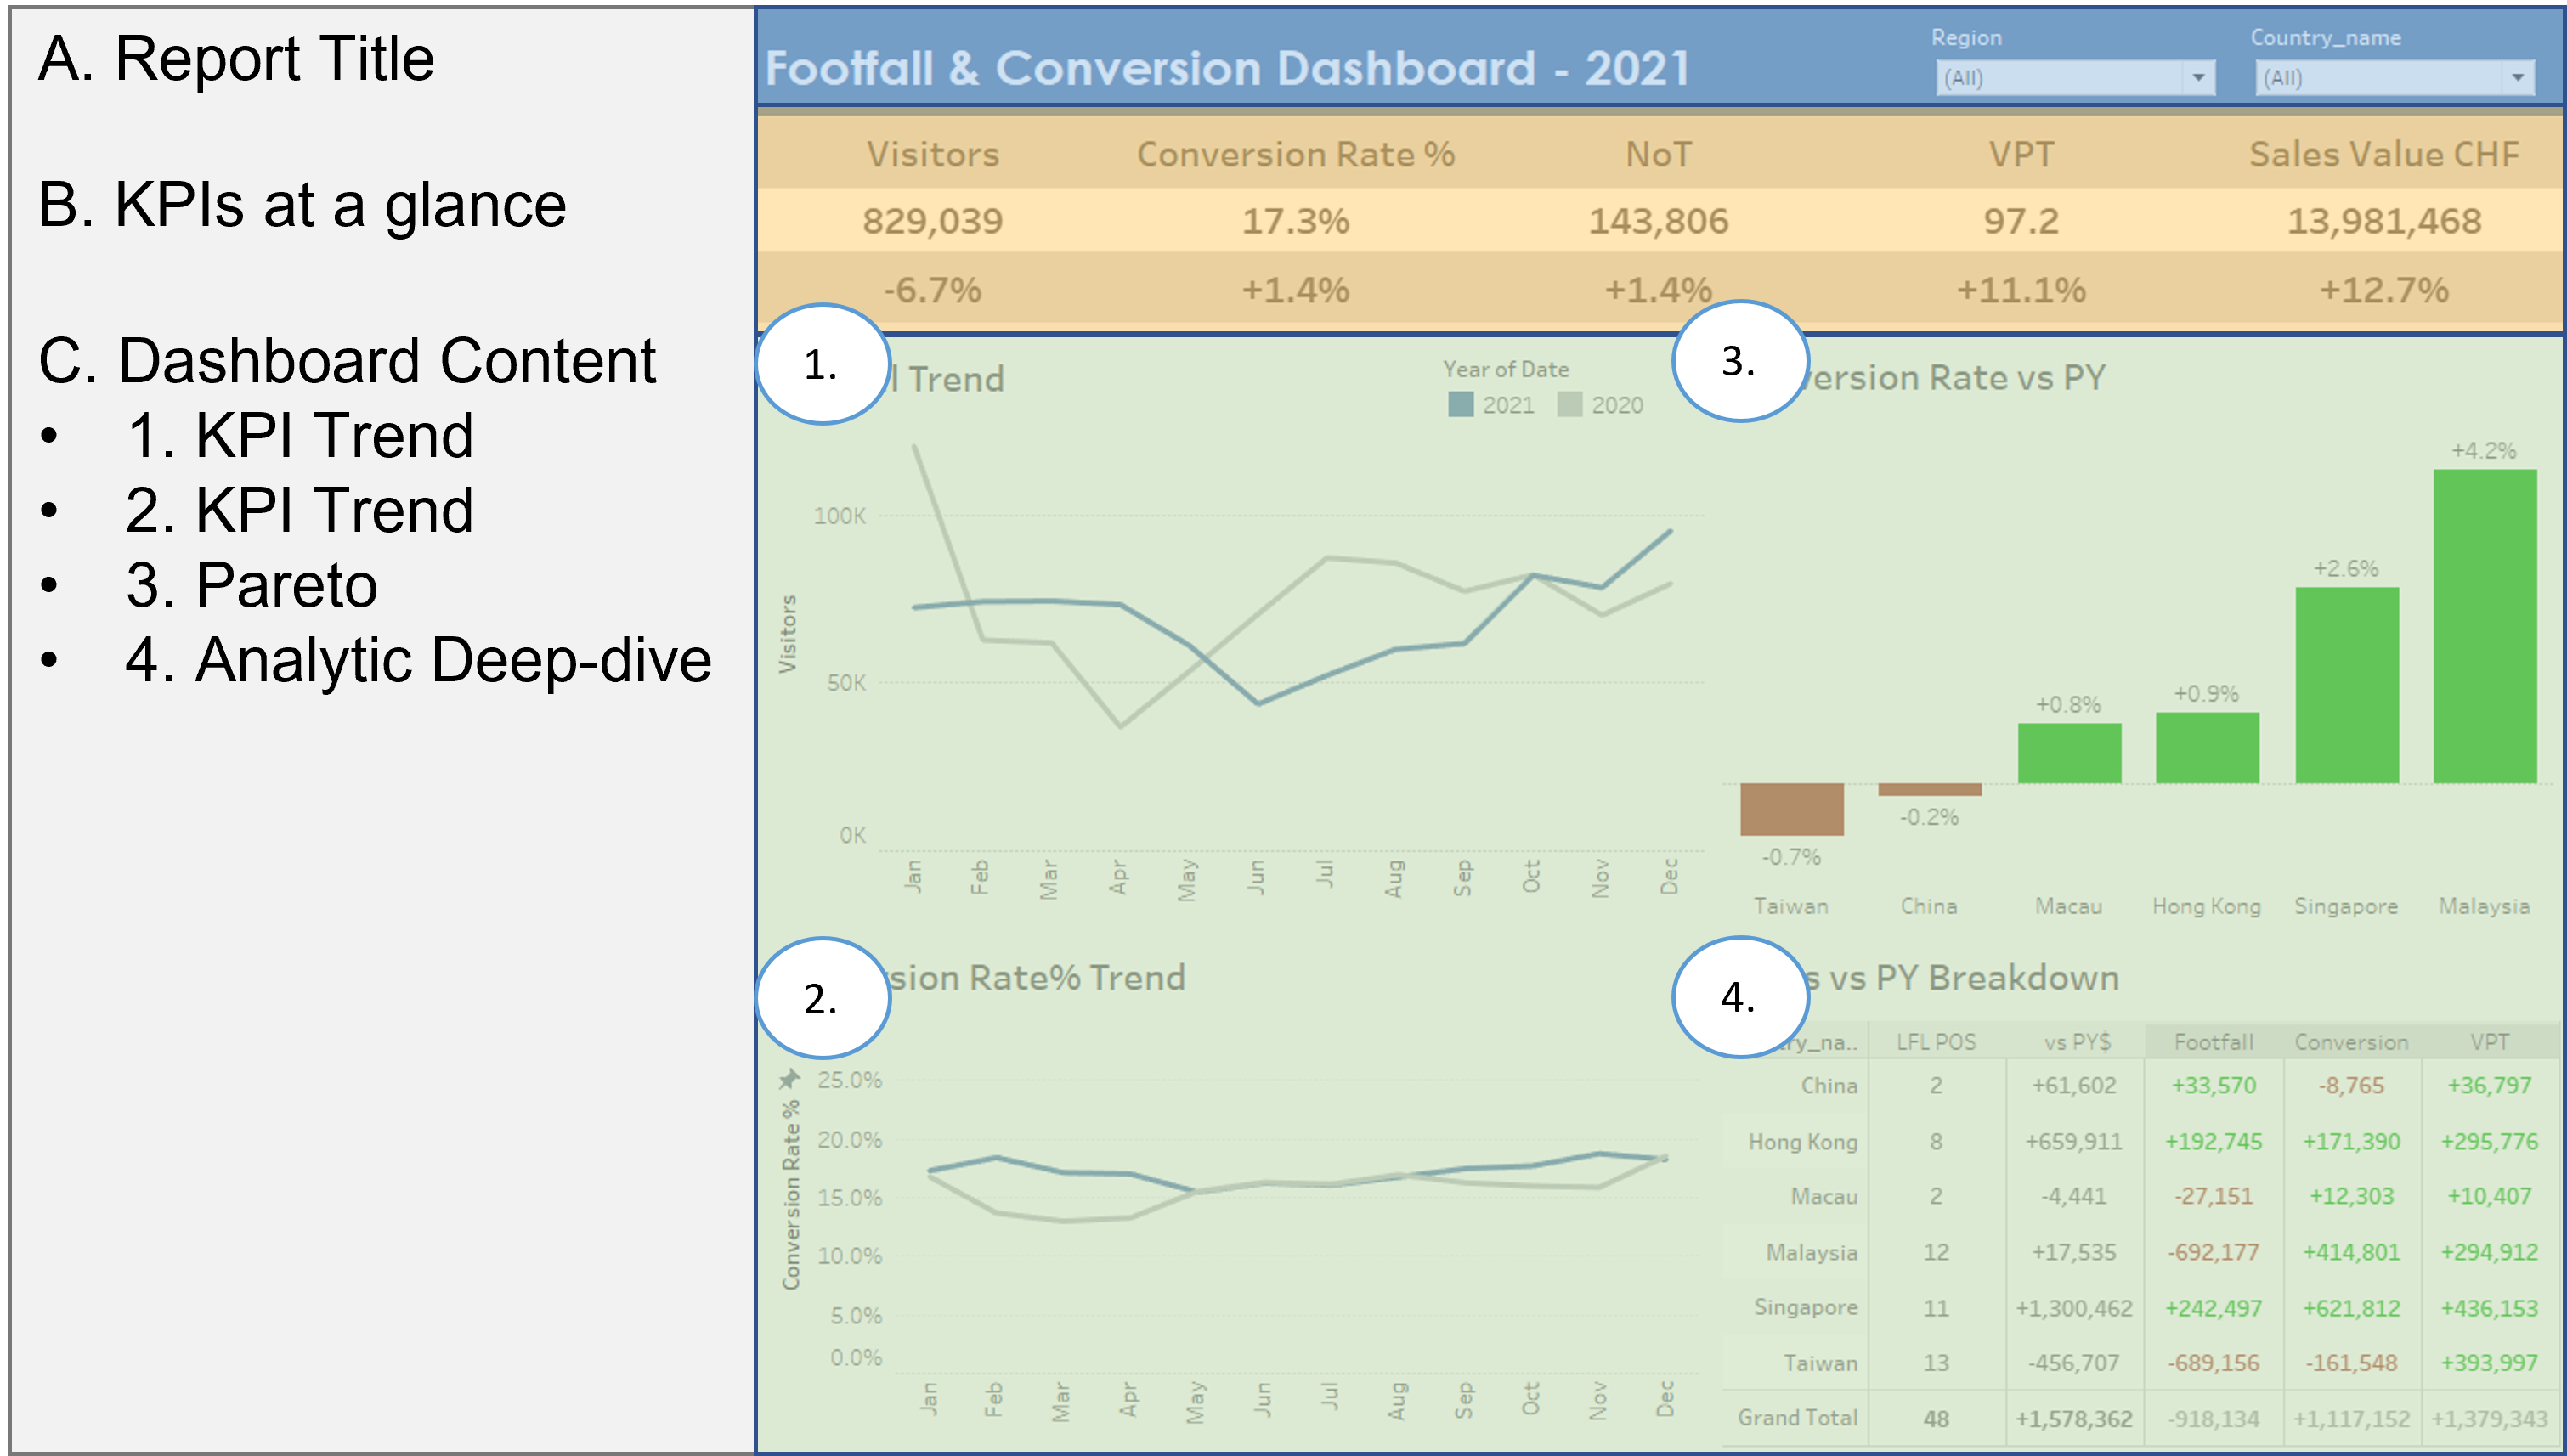
The dashboard consists of three main parts: Report Title, KPIs at a Glance, and Dashboard Content.
The Dashboard Content is divided into four parts:
1. Footfall Trend: Presents a line chart that shows the trend of traffic compared to the previous year.
2. Conversion Rate Trend: Presents a line chart that shows the trend of conversion rate percentage compared to the previous year.
3. Pareto of Conversion Rate: Highlights the departments/countries that need to be followed up on.
4. Analytic Area: Breaks down the factors causing sales decline/increase compared to the previous year. For example, China's sales increased +61k compared to the previous year. This +61k could be broken down into three factors: footfall, conversion, and value per transaction compared to the previous year. In other words, the sales increase in China is mainly due to +34k from footfall increase and +37k from value per transaction increase, compensating for -9k from the decline of the conversion rate
Insight & Recommendation
In 2021, store traffic was still slightly lower than the previous year, with a shortfall of -6.7%, leading to a slight increase in the conversion rate of +1.4%pts. Value per transaction (VPT) increased +11%, driving total company sales up by 12% at year-end.
- Footfall: 2021 Q3 was impacted by Covid but recovered in Q4. Better footfall is expected at the beginning of next year.
- Conversion Rate: The slight increase was driven by Malaysia with 4.2%pts and Singapore with +2.6%pts, compensating for Taiwan's shortfall of -0.7%pts.
- Sales: The overall sales increase was driven by an increase in VPT of +11.2%.
- Taiwan: Both traffic and the conversion rate declined in 2021. Further analysis of store performance will be provided